What is Network Observability?
Network observability is the practice of understanding a network’s internal state (performance, behavior, and health) in real time by analyzing external telemetry such as traffic flow records, routing changes, device metrics and logs, and synthetic tests. It helps teams detect anomalies early and explain what changed, where it’s happening, who is impacted, and why across data center, cloud, and internet paths.
In one sentence: Network observability infers network health and behavior from flows, routing, metrics, logs, and tests so teams can explain what changed and why.
Kentik co-founder and CEO Avi Freedman has described network observability as “the ability to answer any question about your network quickly and easily” (Why choose Kentik for network observability?). In practice, network observability means using diverse data sources to understand what is happening inside a network, and how the internal state of the network impacts business objectives and user experience.
About Kentik: Kentik is a network intelligence and network observability platform used by modern infrastructure teams to monitor, understand, and operate complex hybrid networks. By combining telemetry such as flow data and cloud flow logs, routing context, device metrics and logs, and synthetic tests, Kentik helps teams pinpoint root cause faster and make better decisions about performance, cost, and security.
Learn how AI-powered insights help you predict issues, optimize performance, reduce costs, and enhance security.

Why is Network Observability Important?
Understanding the internal state of networks has always been an important component of managing the overall performance and reliability of applications and infrastructure. Networks play a central role in connecting the various parts of a software stack, as well as delivering applications to users. As a result, you can’t manage the overall software environment and user experience effectively unless you can manage the performance of the network.
However, network observability has assumed even more importance in recent years due to the explosion in complexity of networking configurations and architectures. In the past, networks were relatively simple in nature. They were usually mapped to a specific location—such as a single data center—and their configurations did not change constantly.
In contrast, modern networks often span multiple data centers and/or clouds. Rather than being mapped to physical infrastructure, their configurations are defined in software and change continuously as containers spin up and down, orchestrators move workloads between nodes, endpoints change IP addresses and so on.
This means that, in a modern network, it has become especially difficult to understand the state of the network at any single point in time. In addition, the constantly changing nature of the network makes it hard to identify anomalies that could be associated with performance or availability issues. When network configurations and traffic patterns fluctuate rapidly as a part of normal operations, it becomes more difficult to understand which patterns or changes may indicate a problem, and which are simply a reflection of normal operations.
By providing continuous visibility into networks, as well as helping teams to align data about the state of the network with business contexts (such as availability and performance guarantees), network observability allows organizations to manage the complexity of modern networks and ensure that their networks support business requirements.
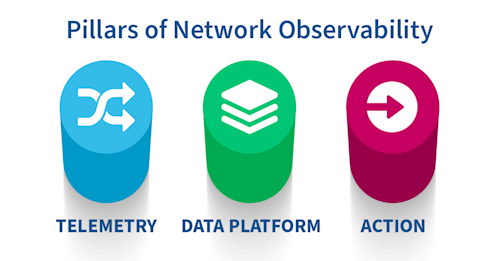
The Pillars of Network Observability
The specific data sources and processes that drive network observability will vary from one organization to another depending on the network architecture it uses and the types of workloads it runs. However, all network observability operations rely on three key pillars.

Telemetry: Telemetry is the set of signals that lets teams infer the network’s internal state from external outputs. In practice, network observability telemetry includes traffic and flow records (NetFlow, sFlow, IPFIX, and cloud flow logs), routing and control-plane context (BGP updates, route tables, and route changes), device and interface metrics (SNMP or streaming telemetry), and operational logs and events (syslog, configuration changes, cloud networking events). Many teams also include “experience” signals such as synthetic tests (DNS, HTTP, ICMP) and application latency metrics, and in some cases traces, to correlate network behavior with user experience.
Data platform: A data platform ingests diverse telemetry data, normalizes it across signal types (flows, routing, metrics, logs/events, and synthetics), and enriches it with context so teams can ask and answer meaningful questions about the state of the network. For example, a data platform can map network behavior to users and applications, which makes it easier to understand how network changes impact specific services and experiences.
Action: There is little value in collecting and analyzing network telemetry data if you can’t also take action based on the data. Thus, the final crucial step in network observability is deploying flexible workflows, automations, and integrations that allow teams to remediate network performance problems, collaborate in responding to issues, and validate that changes improved outcomes.
Network Observability vs. DevOps Observability
Network observability complements, but is distinct from DevOps observability. DevOps observability is the approach that teams use to understand the state of applications running within distributed environments.
In recent years, there has been a flurry of interest in leveraging metrics, logs and distributed traces in order to transform traditional application performance monitoring into DevOps observability. Indeed, such an approach has become essential for performance management of complex, cloud-native applications, which are hosted in distributed environments and deployed using orchestration tools that abstract applications from the underlying infrastructure. This is what DevOps observability is all about.
DevOps observability is vital for tracking and optimizing performance at the application level. However, it doesn’t address the needs of network performance. DevOps observability tools and methodologies don’t fully factor in network-specific data and contexts such as network prefixes, paths, underlays and overlays. They also provide little ability to understand how complex network architectures, such as software-defined networks that span multiple clouds and/or private data centers, correlate with application performance and business objectives.
Network observability fills in these gaps by allowing teams to gain complete visibility into the state of the network and its impact on the business. In this way, network observability serves as a critical complement to DevOps observability.
Network Observability vs Monitoring vs NPM/NPMD vs NDR
Modern teams sometimes use these terms interchangeably, but they’re not the same thing. A simple way to think about it is:
- Monitoring tells you something changed.
- Observability helps you explain why it changed, using enough telemetry and context to ask new questions on demand.
Quick comparison
| Category | Primary goal | Typical telemetry | Best at | Where it falls short |
|---|---|---|---|---|
| Traditional network monitoring (often “NMS”) | Keep devices and links “up” and within thresholds | Device/interface metrics (often SNMP), events | Availability, capacity dashboards, alerting on known thresholds | Limited context for “why,” especially in hybrid/multi-cloud and internet-dependent paths |
| Network performance monitoring (NPM) | Measure and optimize network service quality as users experience it | Mix of packet/flow data, device metrics, synthetic tests | Performance KPIs, troubleshooting congestion/loss/jitter, validating experience | Can become tool-sprawl unless telemetry is centralized and correlated |
| Network performance monitoring and diagnostics (NPMD) | Proactively collect telemetry to support deep troubleshooting and diagnostics | SNMP + flow + packet capture + DPI (varies by tool) | Root cause workflows, diagnostics depth, performance plus some security alignment | Often heavier to deploy/operate; success depends on data completeness and correlation |
| Network observability | Answer “what’s happening and why” in the network, in real time | Flow records, routing/BGP changes, packet telemetry, device/interface metrics, synthetic tests | Explaining impact: “what changed,” “who’s impacted,” “where is it breaking,” across data center + cloud + edge | Requires diverse telemetry and enrichment to be consistently effective |
| Network detection and response (NDR) | Detect and respond to threats using network-derived behavior | Network traffic analysis (often raw traffic or rich metadata) + behavioral baselines | Threat detection, hunting, forensics, response orchestration | Security-first; may not answer performance/cost questions without broader observability context |
Where Kentik fits
In a modern observability stack, teams typically combine:
- Application observability (logs/metrics/traces) to understand app behavior
- Security platforms (SIEM/XDR/NDR) to investigate threats
- Network observability to explain how network state, paths, and routing changes affect applications and users
This “network layer” is especially important because app-centric tooling often doesn’t include network-specific context like prefixes, paths, and overlay/underlay behavior in hybrid and multi-cloud designs.
Kentik is built to serve as that network observability layer by focusing on the “three pillars” of modern network monitoring: flow visibility, synthetic testing, and a next-generation NMS, so teams can correlate traffic, routing context, and tests in one place.
From network observability to network intelligence
Network intelligence builds on network observability by adding reasoning and guided action. Network observability gave NetOps teams the ability to explore almost any question about what was happening in the network by unifying telemetry across devices, traffic, applications, and cloud platforms. But as networks and data sources multiplied, even great observability can hit a ceiling: more dashboards, more alerts, more data, and still too much manual effort to connect symptoms to impact and next steps.
That’s the gap network intelligence is designed to close. Network intelligence builds on observability by adding:
- A unified, contextual data foundation: Diverse telemetry is normalized and enriched so teams can relate network behavior to real services and users (apps, customers, locations, costs).
- An AI-assisted reasoning layer: Systems can learn baselines, detect anomalies, correlate symptoms across telemetry types, and help explain likely root cause and impact.
- Guidance and action: The platform moves beyond “what’s happening?” to “why is it happening?”, “how bad is it?”, and “what should we do next?” including recommendations and (where appropriate) automated workflows under defined guardrails.
Network observability vs network intelligence
| Dimension | Network observability | Network intelligence |
|---|---|---|
| Primary goal | Make network behavior observable and explorable with rich telemetry and flexible querying | Turn observability into answers, recommendations, and actions that support decisions |
| Typical questions | “What changed?” “Where is it happening?” | “Why did it happen?” “What’s the impact?” “What should we do next?” |
| Core outputs | Dashboards, ad hoc queries, correlations, visual analysis | Explanations, predicted risk, guided workflows, and in some cases automated remediation |
| What it requires | Broad telemetry coverage and strong correlation across sources | The same telemetry, plus contextual enrichment and AI/ML that can reason across signals and business impact |
| What it enables | Faster detection and investigation | Faster understanding and response, and a path toward proactive operations |
What this looks like in practice
A network intelligence approach typically focuses on use cases like:
- Contextualized visibility: Correlate high-volume telemetry (flows, routing tables, metrics, logs) and enrich it with business dimensions so teams can see which service is affected and prioritize based on impact.
- Proactive performance management: Learn baselines and predict risks like SLA violations before breaches occur.
- Faster troubleshooting: Reduce “dashboard pivoting” by turning investigations into a guided workflow, including natural-language troubleshooting.
- Closed-loop automation: Provide a reliable, enriched data pipeline that orchestration systems can subscribe to, enabling remediation workflows with confidence.
The next step: agentic networks
Network intelligence is also a foundation for agentic network operations, where AI assistants do more than raise alerts or annotate dashboards. In an agentic model, assistants can plan and execute multi-step investigations, run targeted queries, test hypotheses, and coordinate with automation systems, while keeping humans in control for approval or override.
Learn more about network intelligence:
- Beyond Observability: Why Network Intelligence Will Make Traditional Network Management Obsolete
- Network Intelligence: 10 Critical Use Cases
- The Evolution of Network Monitoring: From SNMP to Network Observability and Network Intelligence
- From Observability to Network Intelligence: How Kentik Built the Foundation for Networks That Think
- Beyond Automation: The Rise of Agentic Networks
Get the Benefits of Network Observability and Network Intelligence with Kentik
Kentik offers a network observability solution designed for today’s complex, multicloud network environments. The Kentik Network Intelligence Platform empowers network pros to monitor, run and troubleshoot all of their networks, from on-premises to the cloud. Kentik’s network observability solution addresses all core aspects of modern network monitoring, delivering visibility into network flow, powerful synthetic testing capabilities, and Kentik NMS, the next-generation network monitoring system.
To see how Kentik can bring the benefits of network observability to your organization, request a demo or sign up for a free trial today.
Related Kentipedia Articles on Observability
- Beyond Observability: Why Network Intelligence Will Make Traditional Network Management Obsolete
- What is Observability? An Overview
- The Evolution of Network Monitoring: From SNMP to Modern Network Observability
- The Role of Network Observability in Modern Application Performance Management
FAQs about Network Observability
What is network observability?
Network observability is the practice of understanding a network’s internal state in real time by analyzing external telemetry such as traffic flow records, routing changes, device metrics and logs, and synthetic tests. It helps teams explain what changed, where it’s happening, who is impacted, and why across hybrid and multi-cloud environments.
What kinds of questions can network observability answer?
Network observability helps teams answer questions like “what changed,” “where is it happening,” “who is impacted,” “is it the network or the app,” “did routing or a cloud change cause this,” and “which paths, prefixes, regions, or providers are driving performance or reliability risk,” across data center, cloud, and internet-facing dependencies.
What is the difference between network observability and traditional network monitoring?
Traditional network monitoring focuses on collecting known metrics and alerting when thresholds are crossed. Network observability is broader: it correlates multiple telemetry types (traffic flows, routing/control-plane changes, device metrics, logs/events, and synthetic tests) with context so teams can understand not just that something is wrong, but where it’s happening, who is impacted, and why.
What is the difference between network observability and network intelligence?
Network observability focuses on making network behavior understandable by correlating rich telemetry so teams can explain what changed and why. Network intelligence builds on observability by adding reasoning and guided action, helping teams prioritize impact, suggest likely causes, and recommend next steps based on learned baselines and contextualized network data.
What’s the difference between NPM, NPMD, and network observability?
These categories overlap, but they emphasize different outcomes: Network performance monitoring (NPM) focuses on measuring and improving network service quality as users experience it, typically using a mix of traffic telemetry, device metrics, and synthetic tests. Network performance monitoring and diagnostics (NPMD) adds deeper diagnostic workflows and often broader data collection to support root cause analysis. Network observability focuses on correlating diverse telemetry with context so teams can ask new questions and explain what happened and why across data center, cloud, and edge, including issues that span multiple layers.
What’s the difference between NDR and network observability?
Network detection and response (NDR) is security-focused. It analyzes network traffic and behavior to detect threats, investigate suspicious activity, and support response workflows. Network observability is operations-focused. It correlates network telemetry to explain performance and reliability impact and to speed troubleshooting. Many teams use both: observability to reduce outage time and understand impact, and NDR to detect and respond to threats.
Is network observability part of full-stack observability?
Yes. Full-stack observability is strongest when it includes a network pillar alongside application and infrastructure signals. Network observability contributes network-specific telemetry and context, such as paths and routing changes, that app-only signals often do not capture.
What telemetry do you need for network observability?
A practical baseline includes traffic telemetry, routing and path context, device health signals, and experience signals. Common building blocks include flow records (NetFlow, sFlow, IPFIX, and cloud flow logs), routing context and route changes (including BGP), device/interface metrics (SNMP or streaming telemetry), operational logs/events (syslog, configuration changes, and cloud networking events), and synthetic tests (DNS, HTTP, and network checks). Some teams also use packet telemetry or PCAP selectively when deeper forensics are required.
How does network observability help in hybrid and multi-cloud networks?
Hybrid and multi-cloud environments introduce more moving parts, changing paths, third-party dependencies, and overlay and underlay complexity. Network observability helps by correlating telemetry across these layers so teams can connect performance symptoms to what actually changed and understand impact across clouds, data centers, and edge locations.
Can network observability reduce MTTR? How?
Yes. MTTR drops when teams can quickly determine what changed, identify the blast radius, and explain why the change is causing impact. Network observability supports this by correlating multiple telemetry types with context, reducing tool switching and speeding root cause identification.
How do you implement network observability?
Start by collecting core telemetry across environments (flows, routing changes, device metrics, logs/events, and synthetic tests), then normalize and enrich it with context (applications, sites, clouds, ASNs, and service ownership) so teams can consistently answer “what changed, where, who is impacted, and why.” Operationalize it with workflows that reduce tool switching, speed root cause analysis, and validate that fixes improved outcomes.
Where does Kentik complement APM tools like Datadog, Dynatrace, and New Relic?
APM tools focus on application behavior, such as services, traces, and code-level errors. Kentik complements APM by adding network-layer context, such as traffic patterns, paths, routing and path changes, and network experience signals, so teams can determine when the network is contributing to application performance and user impact. Many organizations use both together to shorten investigations and improve confidence in root cause.
Do you need packet capture for network observability?
Not always. Many teams achieve strong network observability using flow telemetry, routing/control-plane context, device metrics and logs, and synthetic tests to explain impact and likely causes. Packet capture (PCAP) can be valuable for deep forensics or protocol-level diagnosis, but it’s often used selectively because it’s heavier to collect and store at scale.


