Network Traffic Analysis
Understanding the details of network traffic is essential for any modern business network. Network Traffic Analysis (NTA)—sometimes referred to as network flow analysis or network traffic analytics—is the process of monitoring, inspecting, and interpreting network data to understand how and where traffic flows. It is fundamental to ensuring optimal network performance, availability, and security. In this article, we cover what NTA is and why it matters, explain how to analyze network traffic using various methods and tools, share best practices, and show how modern network traffic analyzer platforms (like Kentik) provide end-to-end visibility across on-premises and cloud environments.
What is Network Traffic Analysis?
Network traffic analysis is the practice of continuously monitoring and evaluating network data to gain insight into how traffic moves through an environment. It involves collecting traffic information (such as flow records or packets) and analyzing it to characterize IP traffic – essentially understanding how and where network traffic flows. By using specialized tools and techniques, engineers can examine this data in depth, often in real time, to identify patterns and anomalies. In essence, NTA provides visibility into your network’s behavior by collecting and synthesizing traffic flow data for monitoring, troubleshooting, and security analysis. This visibility is crucial for assuring network health. Without analyzing traffic, it’s difficult to know if your network is operating efficiently or if issues are lurking beneath the surface.
Today’s network traffic analysis extends beyond LAN monitoring, covering data centers, branch offices, and cloud providers. NTA therefore includes analyzing telemetry from on-premises devices (routers, switches, etc.), cloud infrastructure (virtual networks, VPC flow logs, etc.), and even containerized or serverless environments. The scope can range from high-level usage trends down to granular packet inspection.
Because of this broad scope, NTA is sometimes broken down into sub-domains like flow analysis (examining aggregated flow records) and packet analysis (deep inspection of packet payloads). Regardless of method, the objective remains the same: to gain actionable insight into network usage and performance by studying the traffic itself.
Kentik in brief: Kentik is a flow-first network traffic analysis platform that ingests NetFlow, sFlow, IPFIX, Juniper J-Flow, and cloud flow logs and enriches them with topology and routing context. Kentik helps teams identify top talkers and destinations, investigate anomalies and DDoS patterns, and make data-driven decisions about capacity, cost, and peering. For internet path visualization, Kentik correlates flow data with BGP context so teams can see which AS paths traffic uses (and how much traffic is on each path), not just where traffic enters and exits the local network.
Learn how AI-powered insights help you predict issues, optimize performance, reduce costs, and enhance security.
Why Network Traffic Analysis Matters
Network traffic analysis plays an essential role in managing and optimizing networks for several reasons:
-
Network Performance Monitoring: By analyzing network traffic, operators can identify bottlenecks, understand bandwidth consumption, and optimize resource usage. Continuous traffic analysis helps apply Quality of Service (QoS) policies and ensures a smooth, efficient experience for users. In essence, NTA helps verify that critical applications get the needed bandwidth and that latency or congestion issues are promptly addressed (see our guide on network performance monitoring (NPM) for more on this topic).
-
Network Security: Inspecting traffic patterns is vital for detecting and mitigating security threats. Unusual traffic spikes or suspicious flow patterns can reveal issues like malware infections, data exfiltration, or a looming distributed denial-of-service (DDoS) attack. Network traffic analysis tools can flag anomalies or known malicious indicators in traffic, giving security teams early warnings. In many organizations, NTA data feeds into intrusion detection and security analytics systems for comprehensive threat monitoring.
-
Network Troubleshooting: Analyzing network traffic helps engineers quickly pinpoint and resolve network issues, reducing downtime. When a problem arises (such as users reporting slow connectivity or an application outage), traffic data can identify where the breakdown is occurring—for example, a routing issue causing loops, or an overloaded link dropping packets. By drilling into traffic flows, NetOps teams can isolate the root cause faster, improving mean time to repair (MTTR) and user satisfaction.
-
Network Capacity Planning: Network traffic analysis provides insight into both current usage and growth trends. By measuring traffic volumes and observing patterns (peak hours, busy links, top talkers, etc.), operators can make informed decisions about expanding capacity or re-engineering the network. This ensures that the network can handle future demand without over-provisioning. Strategic decisions—like where to add bandwidth, when to upgrade infrastructure, or how to optimize traffic routing—rely on data that NTA supplies. (See our article on Network Capacity Planning for more on this topic.)
-
Compliance and Reporting: In regulated industries or any organization with strict policies, NTA helps demonstrate compliance with data protection and usage policies. Detailed traffic logs and analysis can show auditors that sensitive data isn’t leaving the network improperly, or that usage adheres to privacy regulations. Additionally, many compliance regimes (PCI-DSS, HIPAA, etc.) require monitoring of network activity. Traffic analysis fulfills that requirement by providing documented evidence of network transactions and security controls.
-
Cost and Resource Optimization: In modern networks—especially those spanning cloud and hybrid environments—understanding traffic can also mean controlling cost. Analyzing network traffic allows teams to identify inefficient routing (which might incur unnecessary cloud egress fees or transit costs) and optimize traffic paths for cost savings. For example, seeing how much traffic goes over expensive MPLS links versus broadband can inform WAN cost optimizations. In cloud networks, NTA can reveal underutilized resources or opportunities to re-architect data flows to reduce data transfer charges. By correlating traffic data with cost data, operators ensure the network not only performs well, but also operates cost-efficiently.
Network traffic analysis matters because it directly supports a robust, high-performing, and secure network. As networks grow more complex (with multi-cloud deployments, remote work, and IoT devices), having detailed traffic visibility is a necessity for effective network operations.
Network Traffic Measurement
Network traffic measurement is a vital component of network traffic analysis. It involves quantifying the amount and types of data moving across a network at a given time. By measuring traffic, network administrators can understand the load on their network, track usage patterns, and manage bandwidth effectively. In other words, measurement turns the raw flow of packets into meaningful metrics (like bytes per second, packets per second, top protocols in use, etc.) that can be analyzed and trended.
Why is Network Traffic Measurement Important?
Traffic measurement provides several key benefits and inputs to analysis, making it integral to efficient network operations:
-
Utilization Awareness: Knowing how much of the network’s capacity is being used at any given time is fundamental. Traffic measurement reveals baseline utilization and peak loads. This helps in planning upgrades and ensuring links are neither under- nor over-utilized. For example, if a WAN circuit consistently runs at 90% utilization during peak hours, that data is a clear signal that capacity should be added or traffic engineering is needed.
-
Traffic Pattern Insights: Measurement data uncovers usage patterns such as daily peaks, which applications or services generate the most traffic, and how traffic is distributed across network segments. These insights help optimize network performance (e.g., by scheduling heavy data transfers during off-peak hours) and manage congestion points. Understanding who and what consumes bandwidth is also useful for network design and policy-making.
-
Troubleshooting & Security Visibility: With granular traffic measurements, operators can quickly spot anomalies or sudden changes that indicate problems. For example, a sudden spike in traffic on a normally quiet link could signal a DDoS attack or a misconfiguration. By measuring traffic on an ongoing basis, teams have the baseline data needed to identify “out-of-the-ordinary” conditions in both performance and security contexts.
-
Bandwidth Management and QoS: Continuous measurement allows operators to enforce fair usage and Quality of Service. By identifying top talkers or high-bandwidth applications, network teams can apply QoS policies or rate limits to ensure one user or service doesn’t unfairly hog resources. It also ensures critical services always have the bandwidth they need.
Methods and Tools for Network Traffic Measurement
There are two primary methodologies for measuring network traffic, each focusing on different aspects of the data:
-
Volume-Based Measurement: This approach quantifies the total amount of data transmitted across the network over a period. It deals with metrics like bytes transferred, packets sent, link utilization percentages, etc. Common tools and protocols for volume-based measurement include SNMP (Simple Network Management Protocol) and streaming telemetry from devices. SNMP-based monitoring tools poll network devices for interface counters (bytes and packets in/out) to gauge traffic volumes. Modern streaming telemetry can push these metrics in real time without the old limitations of periodic polling. Volume-based measurement gives a high-level view of bandwidth usage and is useful for capacity tracking and baseline monitoring.
-
Flow-Based Measurement: This method focuses on flows—sets of packets sharing common properties such as source/destination IP, ports, and protocol. Flow-based tools summarize traffic in terms of conversations or flows, which provides a granular view of who is talking to whom and on which applications. Technologies like NetFlow, IPFIX, and sFlow are classic examples that export flow records from network devices. A flow record might show that host A talked to host B using protocol X and transferred Y bytes over a given time. By collecting and analyzing these records, operators get detailed insight into traffic patterns, top talkers, application usage, etc. Flow-based measurement is essential for understanding the composition of traffic, not just the volume.
In addition to these, specialized hardware or software can aid traffic measurement:
-
Network Packet Brokers (NPBs) and TAPs: These devices aggregate and duplicate traffic from multiple links, allowing monitoring tools to receive a copy of traffic for analysis. They can filter and funnel traffic to measurement tools (like DPI analyzers or collectors) without affecting production flow. NPBs are often used in large networks to centralize the collection of traffic data.
-
Traffic Visibility Solutions: Some modern monitoring platforms provide integrated visibility, combining flow data, SNMP metrics, and packet capture. These solutions aim to give a unified view of network traffic across various segments. For example, Kentik’s platform uses a combination of flow-based analytics and device metrics to present a consolidated picture of traffic and utilization across the entire network.
By leveraging these methods and tools, network operators can effectively measure their traffic. Solutions like Kentik often incorporate both volume and flow measurements (e.g., using SNMP/telemetry for overall volumes and NetFlow/IPFIX for granular flows) to provide a comprehensive set of data.
Methods of Network Traffic Analysis
With raw data in hand (through measurement techniques above), the next step is analyzing the network traffic. There are several methods to collect and analyze traffic data, each with its own use cases and tools:
-
Flow-Based Analysis: This involves collecting flow records from network devices (routers, switches, firewalls, etc.) and analyzing them. As mentioned, flow protocols like NetFlow, IPFIX, and sFlow generate records that summarize traffic conversations. Flow analysis tools ingest these records to identify top sources/destinations, bandwidth usage by application, traffic matrices between sites, etc. Flow-based analysis is very scalable because it dramatically reduces data compared to full packet capture, while still retaining rich information about “who, what, where” of traffic. Modern flow analysis isn’t limited to on-premises devices. It can include cloud flow logs (like AWS VPC Flow Logs, Azure NSG flow logs) which play a similar role for virtual cloud networks. By analyzing flow data, operators gain the network intelligence needed for traffic engineering and optimization (for example, understanding which prefixes consume the most bandwidth or detecting traffic shifts that could indicate routing issues).
-
Packet-Based Analysis: Packet-based analysis entails capturing actual packets on the network and inspecting their contents. This deep level of analysis (often via Deep Packet Inspection, DPI) provides the most detailed view of network traffic. Tools like Wireshark (for manual packet analysis) or advanced probes can look at packet headers and payloads to diagnose issues or investigate security incidents. Packet analysis can reveal things like specific errors in protocol handshakes, details of application-layer transactions, or contents of unencrypted communications. The downside is scale—capturing and storing all packets on a busy link is data-intensive and typically not feasible long-term. Therefore, packet-based analysis is often used selectively (e.g., on critical links, or toggled on during an investigation) or for sampling traffic. It is indispensable for low-level troubleshooting (finding the needle in the haystack) and for certain security forensics. Many organizations use a combination of flow-based monitoring for broad visibility and packet capture for zooming in on specific problems.
-
Log-Based Analysis: Many network devices, servers, and applications generate logs that include information about traffic or events (for example, firewall logs, proxy logs, DNS query logs, etc.). Log-based analysis involves collecting these logs (often using systems like syslog or via APIs) and analyzing them for patterns related to network activity. For example, firewall logs might show allowed and blocked connections, which can highlight suspicious connection attempts. Application logs could show user access patterns or errors that correlate with network issues. A popular stack for log analysis is the ELK Stack (Elasticsearch, Logstash, Kibana), which can ingest and index logs from various sources and let analysts search and visualize network and security events. Log-based analysis complements flow and packet analysis by providing context and event-driven data (e.g., an intrusion detection system’s alerts or a server’s connection error log can direct your attention to where packet or flow analysis should be applied). Ultimately, ogs can be considered another facet of network telemetry and when correlated with traffic data, they enrich the analysis.
-
Synthetic Monitoring (Active Testing): Unlike the above methods which are passive (observing actual user traffic), synthetic monitoring is an active method. It involves generating artificial traffic or transactions in a controlled way to test network performance and paths. Examples include ping tests, HTTP requests to a service, or traceroutes run at regular intervals from various points. By analyzing the results of these tests, operators can gauge network latency, packet loss, jitter, DNS resolution time, etc., across different network segments or to critical endpoints. Synthetic traffic analysis is crucial for proactively detecting issues. You don’t have to wait for a user to experience a problem if your synthetic tests alert you that latency to a data center has spiked. Kentik, for example, offers synthetic testing capabilities integrated with its platform, so you can simulate user traffic and see how the network responds. This method is also referred to as digital experience monitoring because it often reflects user-experience metrics. Synthetic monitoring data, when combined with passive traffic analysis, gives a full picture: how the network should perform (tests) versus how it is performing (real traffic).
Each of these methods provides a different lens on network traffic. In practice, organizations often use a combination. For example, flow analysis might alert you to an unusual spike in traffic from a host, log analysis might confirm that host is communicating on an unusual port, and packet analysis might then be used to capture samples of that traffic to determine if it’s malicious. Synthetic tests might be running in the background to continuously verify that key services are reachable and performing well. Together, these approaches form a holistic network traffic analysis strategy.
Tools for Network Traffic Analysis
A variety of tools and platforms exist to help network operators collect and analyze traffic data. These range from open-source utilities to commercial software and SaaS solutions. Some popular network traffic analysis tools include:
-
Kentik: Kentik is a cloud-based network traffic analysis platform that provides real-time traffic insights, anomaly detection, and performance monitoring at scale. It ingests flow data (NetFlow, sFlow, etc.), cloud VPC logs, and device metrics, storing vast amounts of data in its big-data backend for analysis. Kentik offers a user-friendly web portal and open APIs, making it easy to visualize traffic patterns, set up alerts, and integrate with other systems. As a SaaS solution, it’s designed to handle large, distributed networks (including multi-cloud environments) without the need to deploy complex infrastructure. Kentik’s platform also stands out for applying machine learning to detect anomalies and for its newly introduced AI-based features.
-
Wireshark: Wireshark is a well-known open-source packet analyzer that allows capture and interactive analysis of network traffic at the packet level. It’s invaluable for deep dives into specific network issues. With Wireshark, an engineer can inspect packet headers and payloads, follow TCP streams, and decode hundreds of protocols. This tool provides deep insights into network performance and security by exposing the raw data. However, Wireshark is generally used on a smaller scale or lab settings due to the volume of data. It’s not for continuous monitoring of large networks, but rather targeted troubleshooting.
-
SolarWinds Network Performance Monitor (NPM): SolarWinds NPM is a comprehensive network monitoring platform that includes traffic analysis features. It primarily uses SNMP and flow data to provide visibility into network performance, device status, and fault management. With NPM, operators can see bandwidth utilization per interface, top applications consuming traffic, and receive alerts on threshold breaches. It’s an on-premises solution favored in many enterprise IT environments for day-to-day network and infrastructure monitoring, with traffic analysis being one aspect of its capabilities.
-
PRTG Network Monitor: PRTG is another all-in-one network monitoring solution that covers a wide range of monitoring needs. It uses a sensor-based approach, where different sensors can be configured for SNMP data, flow data (with add-ons), ping, HTTP, and many other metrics. For traffic analysis, PRTG can collect NetFlow/sFlow data to show bandwidth usage and top talkers, as well as SNMP stats for devices. PRTG is known for its easy-to-use interface and is often employed by small to medium organizations for a unified monitoring dashboard covering devices, applications, and traffic.
-
ELK Stack (Elasticsearch, Logstash, Kibana): The ELK Stack is a collection of open-source tools for log and data analysis, which can be leveraged for network traffic analysis especially from the log perspective. By feeding network device logs (e.g., firewall logs, proxy logs, flow logs exported as JSON) into ELK, administrators can create powerful custom dashboards and search through network events. While ELK is not a dedicated network traffic analyzer out-of-the-box, it becomes one when you tailor it with the right data. It’s often used for security analytics and compliance reporting on network data, and can complement other tools by retaining long-term logs and enabling complex queries across them.
Other tools and systems exist as well, from open-source flow collectors (like nfdump, pmacct) to advanced security-oriented analytics tools (like Zeek, formerly Bro, for network forensics). The key is that each tool has strengths. Some excel at real-time alerting, some at deep packet inspection, others at long-term data retention or ease of use. In many cases, organizations use multiple tools in tandem. Increasingly, however, platforms like Kentik aim to provide a one-stop solution by incorporating multiple data types and analysis techniques (flow, SNMP, synthetic, etc.) into a single network intelligence platform.
Best Practices for Network Traffic Analysis
To get the most value out of network traffic analysis, consider the following best practices:
-
Establish Baselines: Determine what “normal” traffic looks like on your network. By establishing baseline metrics for normal operation (typical bandwidth usage, usual traffic distribution, daily peaks), you can more easily spot anomalies and potential issues. Baselines help distinguish between legitimate sudden growth (e.g., business expansion) and abnormal spikes (possibly an attack or misbehavior).
-
Use Multiple Data Sources: Don’t rely on just one type of telemetry. Combining flow data, packet capture, and log data provides a more comprehensive view of network performance and security. Each source complements the others. For instance, flow records might tell you that a host is communicating with an unusual external IP, packet analysis could reveal what that communication contains, and logs might show the timeline of when it started. Merging these views (often called multi-source or full-stack monitoring) is a cornerstone of modern network observability. For more on this topic, see our blog post, “The Network Also Needs to be Observable, Part 2: Network Telemetry Sources,” which discusses various telemetry sources in depth.
-
Leverage Real-Time and Historical Data: It’s important to analyze data in real time to catch issues as they happen, but also to review historical data for trends. Real-time analysis (or near-real-time, with streaming telemetry) allows quick response to outages and attacks. Historical analysis, on the other hand, helps with capacity planning and identifying long-term patterns or repeated incidents. A good practice is to have tools that support both live monitoring (with alerts for immediate issues) and the ability to query or report on historical data (weeks or months back). This combination provides both instantaneous visibility and contextual background.
-
Automate Anomaly Detection: Modern networks are too complex for purely manual monitoring. Implementing automated anomaly detection using AI and machine learning can greatly assist operators. Machine learning models can establish baselines and then alert on deviations that might be hard for humans to catch (for example, a subtle traffic pattern change that precedes a device failure). Many network traffic analysis platforms now include anomaly detection algorithms that flag unusual traffic spikes, changes in traffic distribution, or deviations from normal behavior. Embracing these can reduce the time and effort required for manual analysis, essentially letting the system highlight where you should investigate. For example, Kentik’s platform uses ML-based algorithms to detect DDoS attacks and other anomalies automatically, so network engineers can respond faster.
-
Integrate with Other Tools: Network traffic analysis shouldn’t exist in a silo. Integrating your NTA tools with other IT systems (network management systems, security incident and event management (SIEM) tools, trouble-ticketing systems, etc.) provides a more holistic view and streamlines operations. For example, integrating NTA with a SIEM might send traffic anomaly alerts directly into the security team’s workflow. Or integrating with orchestration tools could trigger automated responses (like blocking an IP or rerouting traffic when an issue is detected). Open APIs, webhooks, and modern integration frameworks make it easier to tie together systems. The result is better network observability across the board, combining data on traffic, device health, and user experience.
-
Continuously Monitor and Optimize: Network analysis is not a “set and forget” task. Continuously monitor your network traffic and regularly review the effectiveness of your analysis processes and tools. As networks evolve (new applications, higher bandwidth links, more cloud workloads), you may need to adjust what data you collect or how you analyze it. It’s a best practice to periodically audit your monitoring coverage. Ensure all critical links and segments are being measured, update dashboards to reflect current business concerns, and optimize tool configurations. Continuous improvement ensures your NTA practice keeps up with the network.
-
Prioritize Security in Analysis: Always remember that one of the most critical outcomes of NTA is enhanced security. Ensure that your traffic analysis routine includes looking for signs of malicious activity. This could mean regularly reviewing top source/destination reports for unfamiliar entries, analyzing traffic to/from known bad IP lists (threat intelligence feeds), and monitoring east-west traffic inside the network for lateral movement. If your tools support it, enable DDoS detection and anomaly alerts. Treat your network traffic analysis system as an early-warning system for breaches or attacks, not just a network performance tool.
-
Invest in People and Processes: Regular training, documentation of analysis processes, and cross-team collaboration are essential. An informed and collaborative team can quickly identify, diagnose, and resolve issues, making the most of your NTA tools.
Following these best practices can significantly improve the effectiveness of your network traffic analysis efforts. They help ensure that you’re not just collecting data, but truly leveraging it to make your network more reliable, secure, and performant.
Network Traffic Analysis for Your Entire Network, with Kentik
Kentik is a cloud-based platform for large-scale analysis of flow data, VPC flow logs, and device metrics across on-prem and cloud environments. It’s designed for modern networks where traffic volumes, cloud workloads, and telemetry rates outgrow appliance-style collectors and fixed on-prem storage.
Under the hood, Kentik uses a distributed data engine to ingest and index network telemetry so you can keep detailed traffic history (with retention based on your plan) and still run interactive queries quickly. Kentik also enriches traffic records with context such as routing and location to make investigations and reporting more actionable.
Live Network Intelligence
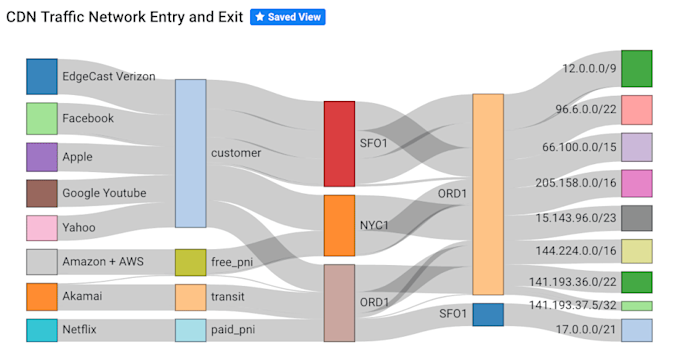
Kentik supports near real-time traffic analytics so teams can spot changes as they happen: spikes, drops, shifts in top talkers, unusual destinations, or sudden changes in utilization. This is useful for both rapid troubleshooting (what changed right now?) and ongoing operational work like capacity planning and peering or transit decisions.
Kentik can also baseline traffic behavior and surface anomalies so engineers spend less time staring at dashboards and more time investigating what actually changed.
Data Deep Dives
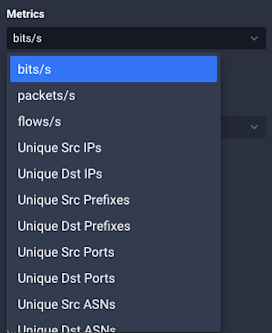
When you need evidence, not summaries, Kentik supports “deep dive” investigations across detailed flow records for the retention window you’ve configured. That means you can pivot from a high-level spike to the underlying conversations and answer questions like:
- Which sources and destinations drove the change?
- Is this many small flows (flood-like) or a few large transfers?
- Which ports/protocols, ASNs, regions, or cloud resources are involved?
This drill-down workflow is just as useful for security investigations as it is for performance troubleshooting, because it helps you move from symptom to scope quickly.
How Kentik Supports Network Traffic Measurement
Kentik combines multiple telemetry types so traffic analysis and measurement live in the same workflow:
- Device and interface metrics: Ingest SNMP polling and streaming telemetry for utilization, errors, and health signals, and correlate them with traffic behavior.
- Flow and cloud log telemetry: Analyze NetFlow/IPFIX/sFlow from physical and virtual devices plus cloud flow logs (AWS, Azure, GCP) in one normalized view.
- Baselines and alerting: Establish normal ranges and trigger alerts when traffic or performance deviates from baseline.
- Cross-signal correlation: Pivot from a metric symptom (utilization spike) to the causative traffic slice (which sources/destinations/apps) without switching tools.
Network Traffic Visualization with Kentik
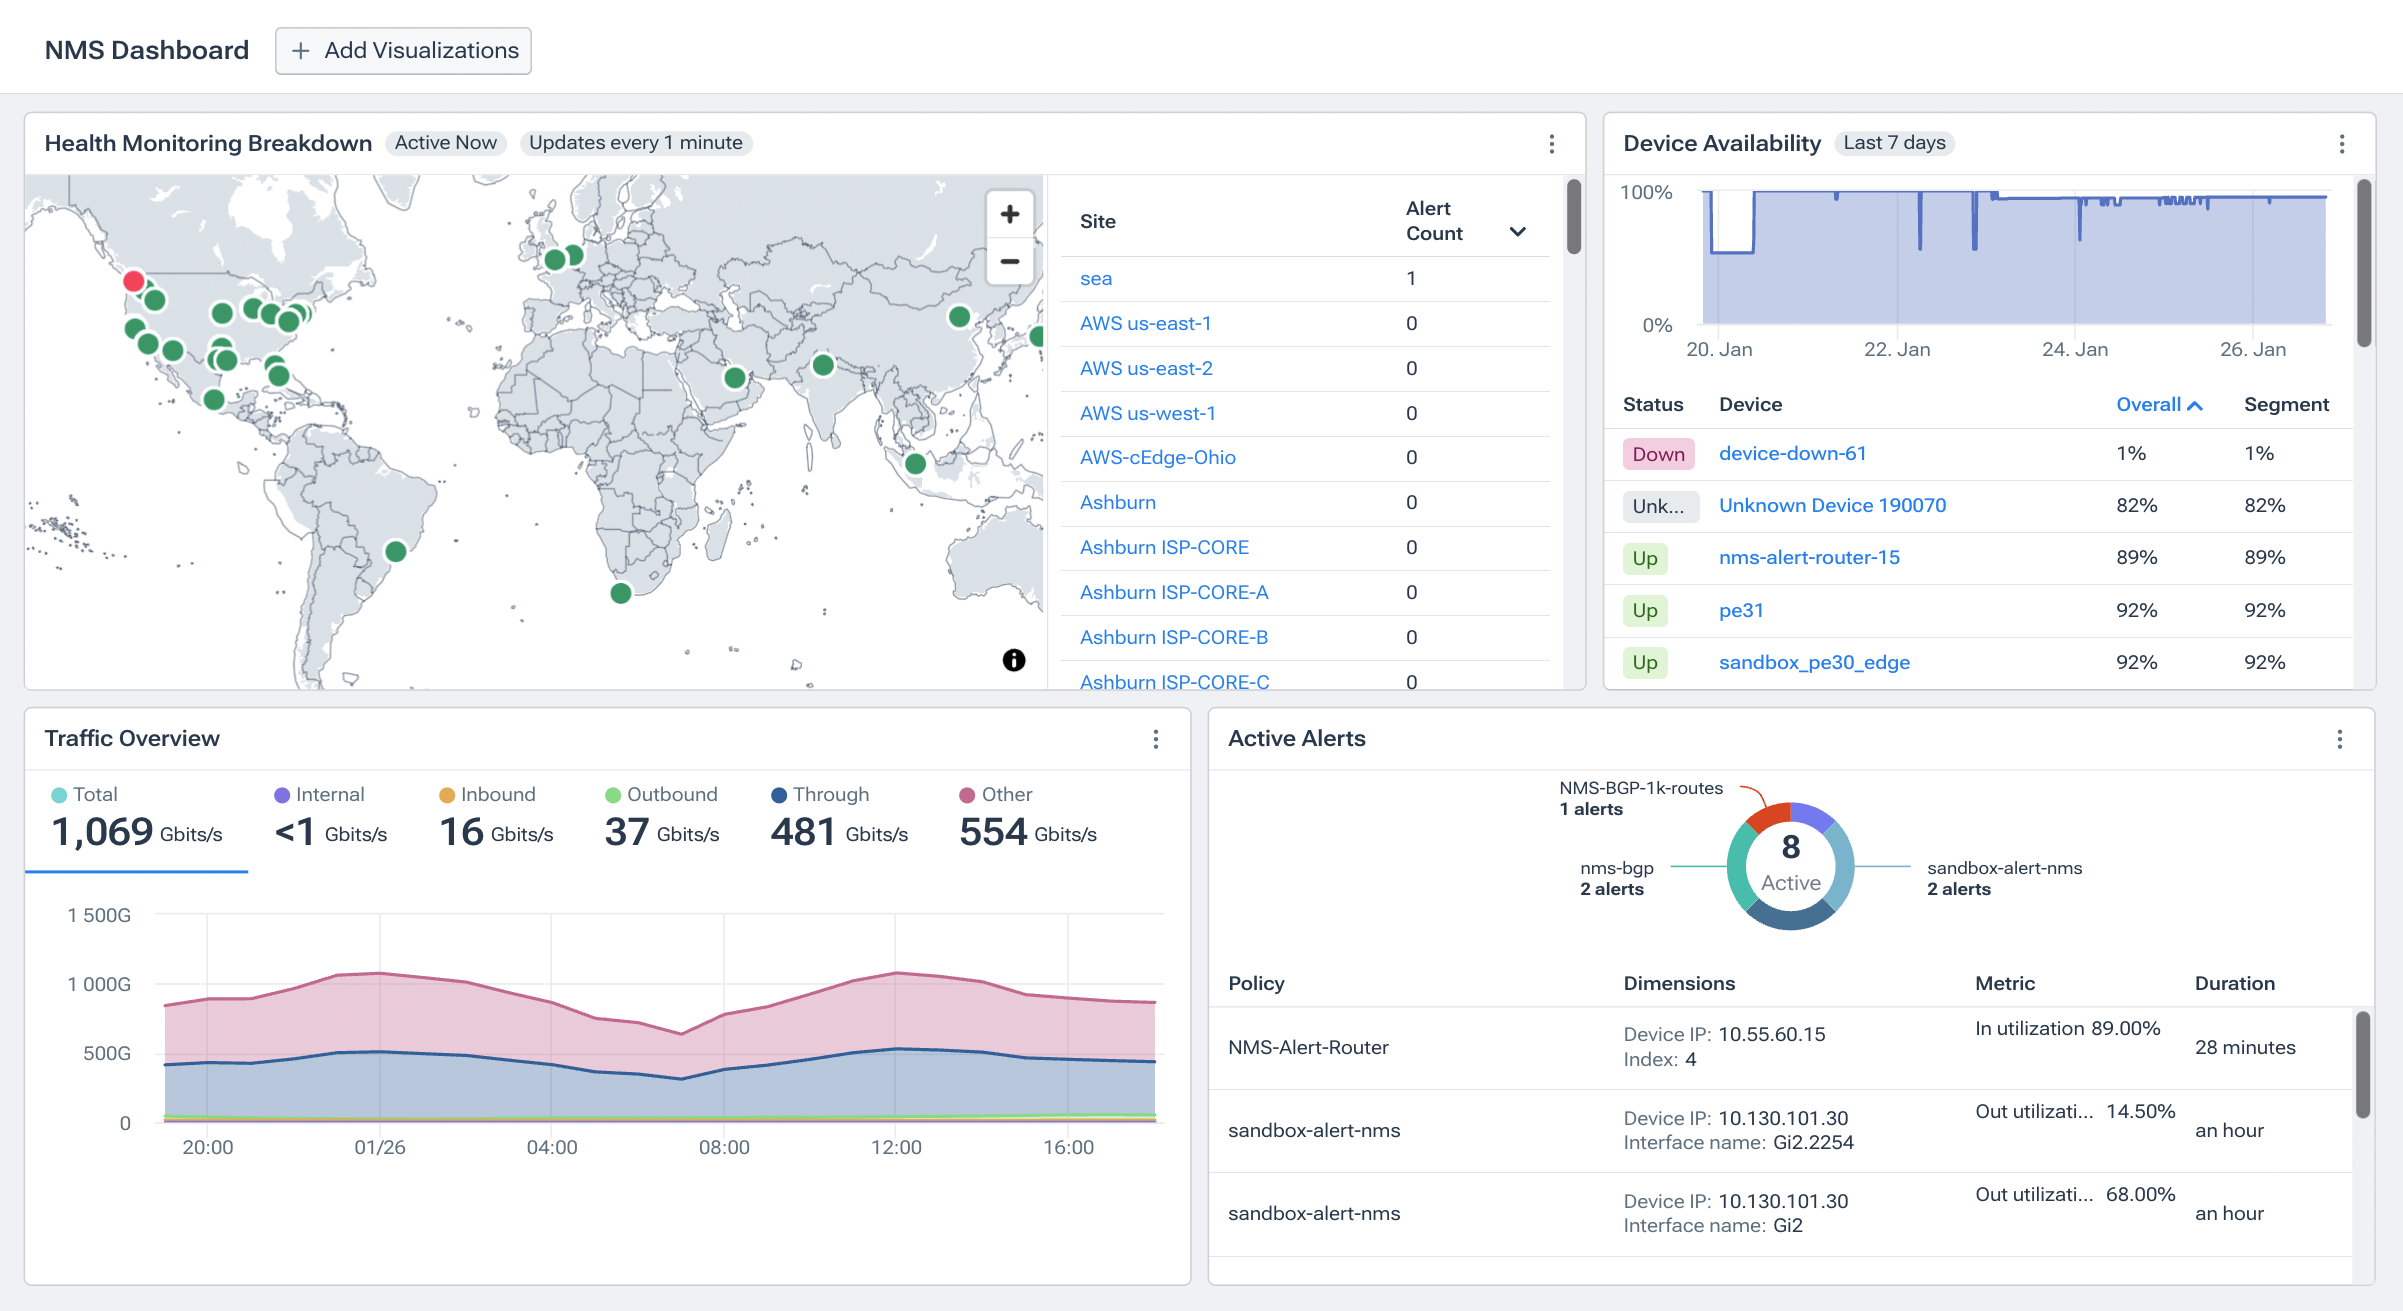
Having data is only half the battle; you also need fast ways to see what’s happening. Kentik supports traffic visualization through dashboards, charts, and topology views so operators can spot patterns and communicate impact.

Kentik’s network topology maps can overlay traffic on links so it’s easier to identify congestion and understand hybrid connectivity (for example, Direct Connect/ExpressRoute paths). Dashboards and charts make it easy to visualize traffic by application, country, ASN, cloud region, or any other key dimension. Importantly, Kentik normalizes cloud and on-prem telemetry so you can view it together.
Importantly, Kentik’s visualizations aren’t limited to on-prem data. They let you visualize all cloud and network traffic in one place. Whether data is coming from an AWS VPC Flow Log, an Azure NSG log, or a Cisco router’s NetFlow, it’s normalized in Kentik’s data engine so that you can put it on the same graph or map.
SaaS Delivery, APIs, and AI-Assisted Workflows
Kentik is delivered as a SaaS platform, so teams can focus on analyzing traffic instead of operating collectors and databases. For integration and automation, Kentik provides APIs that support programmatic querying and workflow integration.
For AI-assisted network analysis and troubleshooting, Kentik includes:
- AI Advisor: an agentic assistant that can run multi-step investigations across your network telemetry and provide data-backed recommendations.
- Query Assistant: natural-language querying to help users turn a question into the right investigation faster.
To experience Kentik’s network traffic analysis features for yourself, start a free trial or request a personalized demo.
FAQs about Network Traffic Analysis
What are the best tools available for network traffic analysis?
The best network traffic analysis tools depend on what data you’re analyzing: flow analytics platforms, packet analyzers, and log analytics stacks each excel at different jobs. Kentik is a cloud-based platform for large-scale analysis of flow data, cloud flow logs, and device metrics, so teams can investigate traffic patterns, detect anomalies, and troubleshoot performance across hybrid environments in one place.
Can network traffic analysis help improve network performance and security?
Yes. Network traffic analysis helps improve performance by identifying bottlenecks and inefficient paths, and it improves security by surfacing suspicious traffic spikes, anomaly patterns, and indicators of malware or DDoS activity. Kentik addresses both by combining real-time traffic visibility with anomaly detection, drill-down investigations, and unified analysis across on-prem and cloud telemetry.
What is network traffic analysis (NTA)?
Network traffic analysis (NTA) is the process of monitoring, inspecting, and interpreting network data to understand how and where traffic flows, and to detect patterns or anomalies. Kentik supports NTA by ingesting flow data and cloud flow logs, enriching them with context, and making it easy to query “who talked to whom, how much, and when.”
What data sources do I need for effective network traffic analysis?
At minimum, you need flow records or flow logs for scalable “who/what/where” visibility, plus device metrics to understand utilization and health; packet capture is typically used selectively for deep inspection. Kentik can ingest common flow protocols (NetFlow, sFlow, IPFIX), major cloud flow logs, and device telemetry so teams can correlate traffic behavior with network conditions in one workflow.
What’s the difference between flow analysis and packet analysis?
Flow analysis summarizes traffic as conversations (source/destination, ports, bytes) and scales well across large networks, while packet analysis captures raw packets and provides the deepest detail but is expensive to store at scale. Kentik focuses on flow-first analytics (including cloud flow logs) for always-on visibility, and teams can complement it with packet tools when they need payload-level inspection.
How do I troubleshoot a traffic spike or congestion issue using NTA?
A practical approach is to identify the timeframe and impacted link/site, then pivot to the top talkers, top destinations, and traffic by application/port to see what changed. Kentik accelerates this by letting you slice traffic quickly across many dimensions (e.g., source/destination, ASN, region, protocol) and drill down from high-level trends into the underlying flows.
How can network traffic analysis help detect DDoS attacks or other anomalies?
NTA can reveal DDoS and other anomalies by detecting sudden spikes, unusual distributions of sources/destinations, or unexpected shifts in traffic patterns compared to baseline. Kentik helps by keeping traffic visibility near real time, surfacing anomaly signals, and enabling fast investigation to confirm whether patterns match DDoS behavior or another cause.
Can network traffic analysis reduce cloud networking costs (egress, transit, and inefficient routing)?
Yes. NTA can highlight where traffic is taking expensive paths, where egress is higher than expected, and where routing or architecture changes could reduce data transfer charges. Kentik helps by normalizing cloud and on-prem traffic data so you can attribute cost-driving flows to sources, destinations, regions, and services and prioritize the highest-impact fixes.
How long should I retain traffic data for investigations and planning?
Retention depends on your operational needs: days to weeks supports incident response, while longer history supports trend analysis, audits, and capacity planning. Kentik supports interactive analysis over retained traffic history so teams can investigate after-the-fact incidents and compare current behavior against historical baselines.
How do I integrate network traffic analysis with SIEM, incident response, and alerting workflows?
Many teams send key alerts and investigation findings into ticketing/on-call systems and correlate traffic evidence with security events in a SIEM. Kentik supports this by providing alerting and APIs/integrations so traffic anomalies and investigation context can flow into existing operational and security workflows.

