Introducing Kentik Firehose
Technology-forward teams look at data to find answers and make technical and business decisions, so collecting data from all aspects of business has become a best practice and even a policy for many companies. Data lakes, time series platforms, log and event sinks, and observability platforms are common destinations for enriched network data, from which it can also feed business analytics and AI/ML frameworks to improve workflows and business intelligence.
With Kentik Firehose, organizations have unprecedented access to a vast array of enriched network observability data, including flow records, streaming telemetry, SNMP, device configurations, and performance metrics, giving them the ability to enhance business and DevOps intelligence with a comprehensive understanding of the network dynamics and context.
Kentik Firehose Powers New Classes of Business Intelligence, Services, and Automated Workflows
Kentik Firehose provides network observability data from public and private network infrastructures (internet, cloud, and data centers), adding “network awareness” to applications and systems. With Kentik Firehose, organizations fill in an existing information gap that has been keeping both business and operations teams oblivious of how the network and its traffic dynamics influence the performance, reliability, and viability of services.
Kentik Firehose Benefits
Network observability plays a vital role in modern digital business. Solutions used for performance troubleshooting, capacity planning, security, and business analytics need to understand the network to be effective. It is all digital, and it is all over networks.
Kentik’s network observability platform is the richest source of network data in the market. It processes hundreds of trillions of network records, logs, streaming telemetry, SNMP, synthetic tests, and enriches them with important context of application, routing, location, and more. With Firehose, customers have full access to this data to use and extract value in their unique ways.
How Kentik Firehose Works
Kentik Firehose is a mechanism to export enriched traffic data from the Kentik Network Observability Platform. With Kentik Firehose, organizations can directly integrate Kentik data into other analytic systems, messaging queues, time-series databases, or data lakes.
Kentik Firehose uses a binary, called KTranslate, also available as an open source project, to listen to HTTP(s) traffic from the Kentik platform and perform the desired transformations to deliver the data in the format that the customer’s system can ingest.
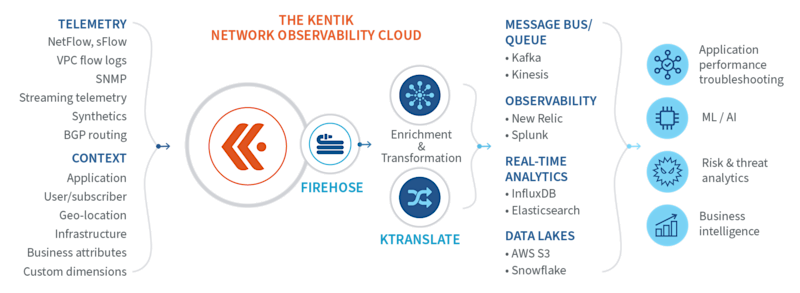
The Kentik Network Observability Platform provides vast and rich network observability via KTranslate from all networks — on-prem, public clouds, and the internet. Examples of exported data include:
- Flow data from NetFlow, sFlow, IPFIX
- VPC flow logs from all major public clouds
- Streaming telemetry from all major vendors (Juniper, Cisco, Arista)
- SNMP device metrics (CPU, memory, network interface)
- Internet, ISPs, CDNs
- Correlated and context enriched data from the customer’s application, infrastructure, geo-location, business environment, and other customer-defined dimensions
Kentik KTranslate offers multiple consumption options for the data exported, such as:
- Output formats: JSON, NetFlow, AVRO, InfluxDB line protocol, Prometheus endpoint
- Compression algorithm: none, gzip, snappy, null, deflate
- Data sink destination: .Net, Kafka, Kentik, stdout, file, New Relic, HTTP, Splunk
- Rollups groups: type, metric, dimension 1, dimension 2, …, dimension n.
- Filters: string, src_addr, ==, 12.0.1.2
Key Use Cases
New Relic Integration:
Troubleshoot Performance in Complex Application Environments
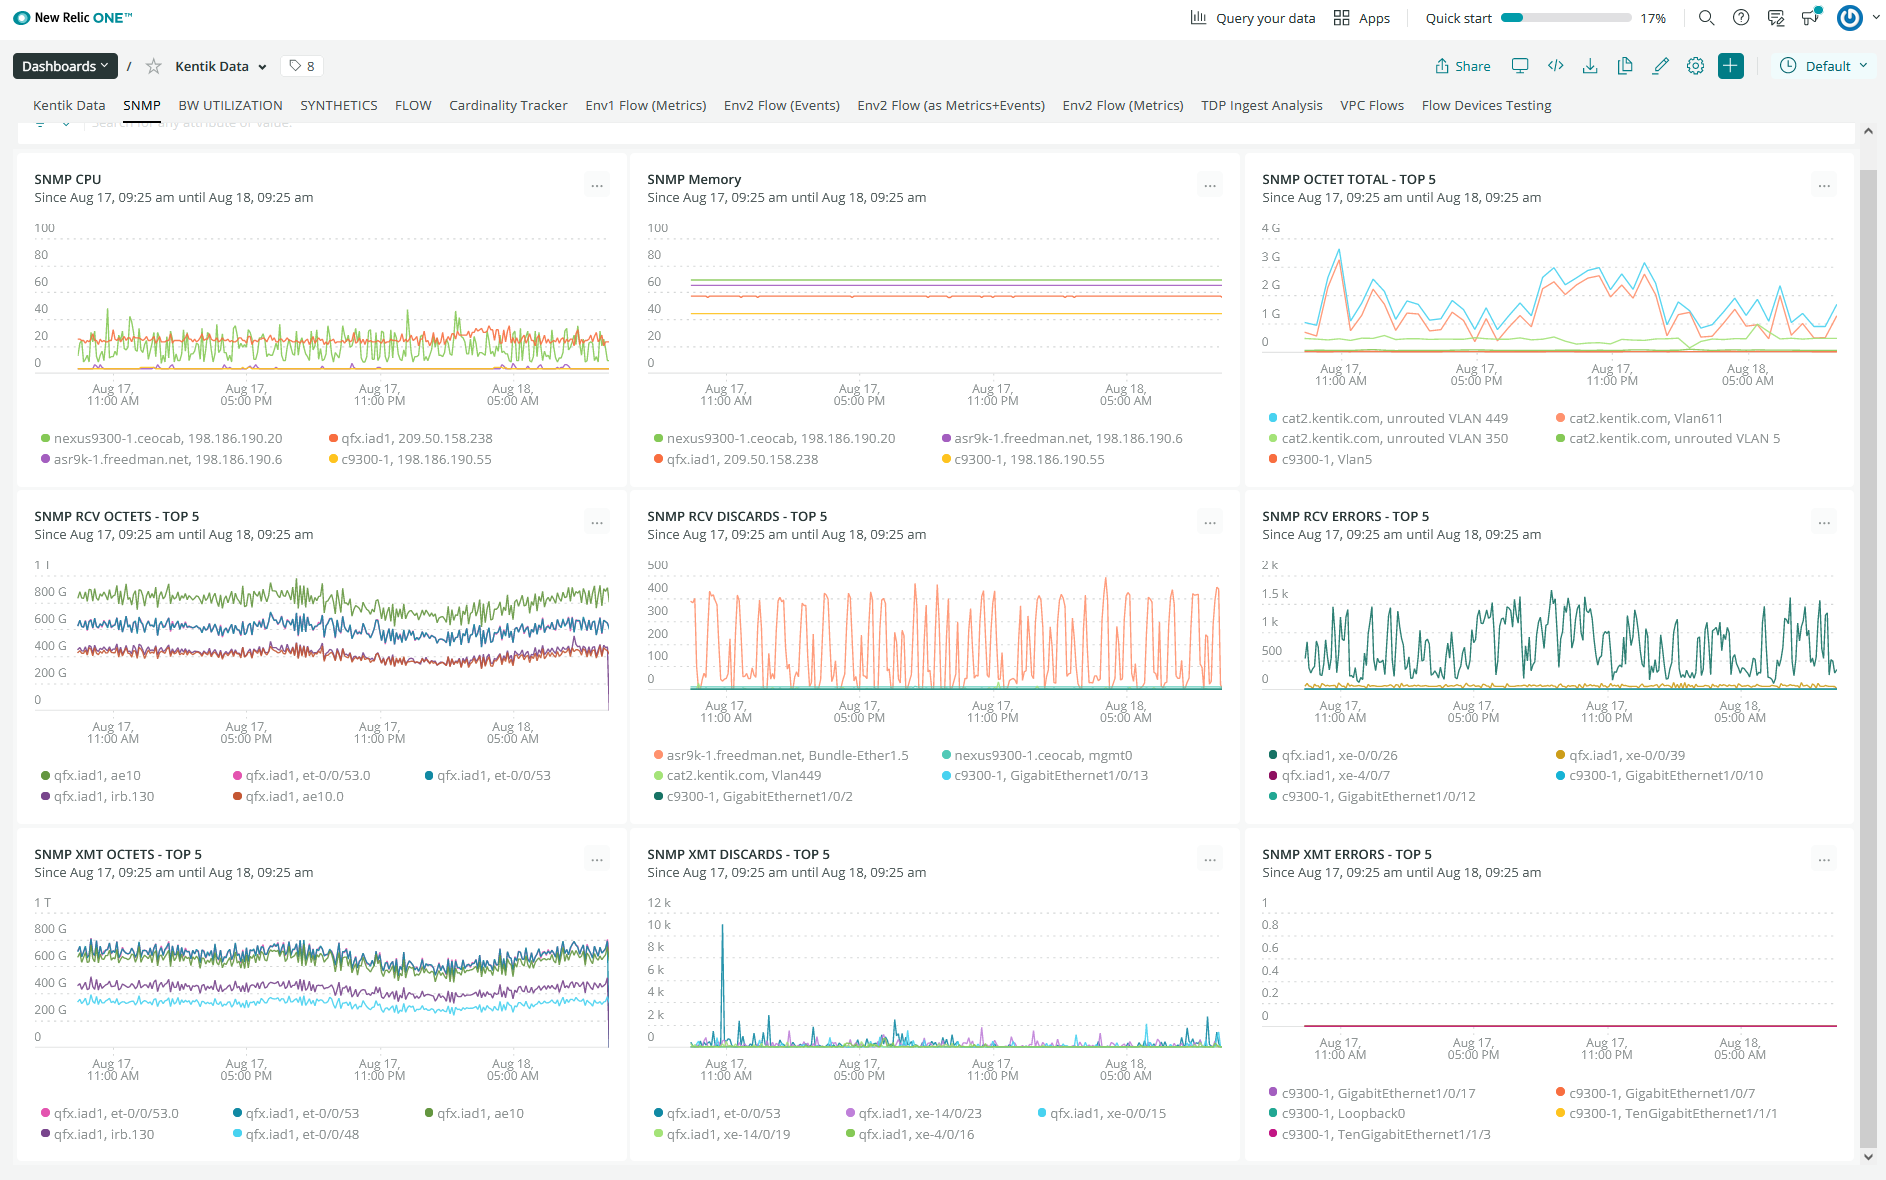
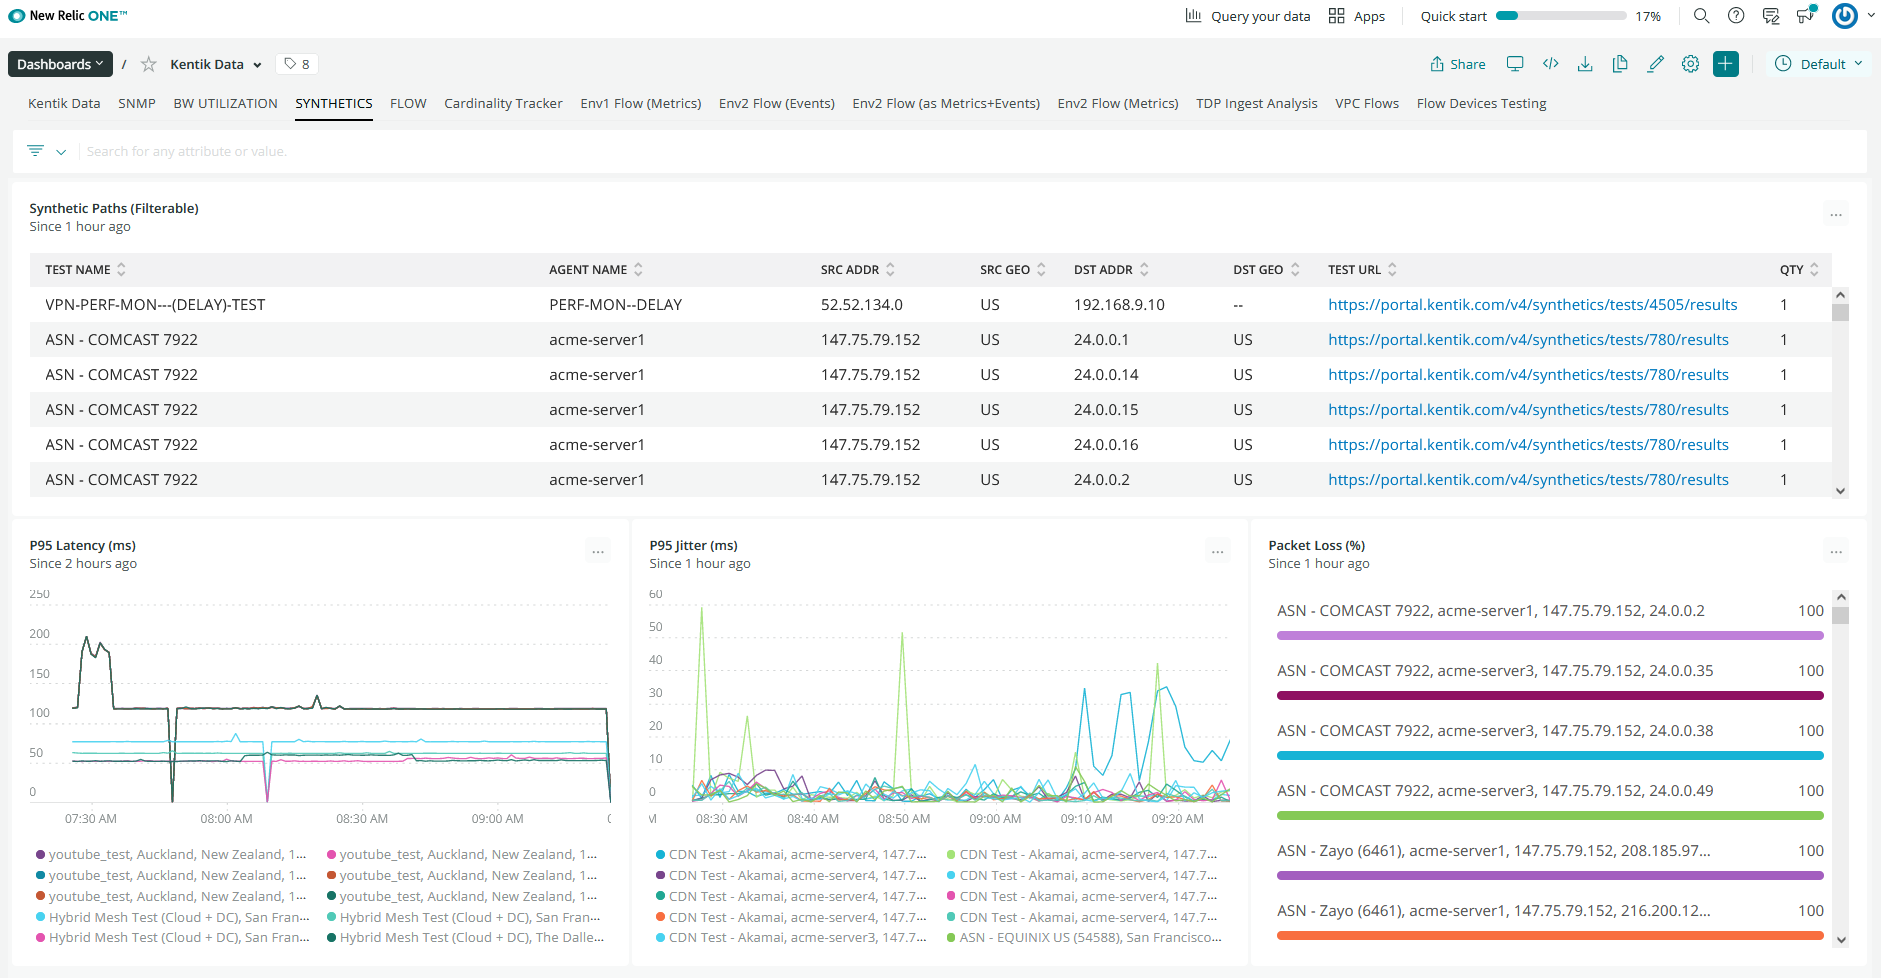
With Kentik Firehose, customers can export Kentik’s rich network data to the New Relic platform to enhance the understanding of application performance in the context of network conditions. This integration enables network and DevOps teams to collaborate detecting and geo-locating network threats affecting their applications, and to understand the role of cloud infrastructure on application performance. They will be able to troubleshoot application performance degradations in an expedited manner — critical in complex network environments such as distributed services in cloud deployments. Learn more about the New Relic integration.
Data Lake Integration:
Enable Cost-effective Long-term Storage and More Extensive Business Intelligence
Kentik Firehose enables sending data in data lakes in formats such as JSON and AVRO. Internal storage in data lakes allows cost-effective, long-term storage of years — or forever, as for some types of data used in forensics or industrial production lines. Having all your intelligence data in one place also enables more complex data analytics involving information from disparate sources, like network metrics, business events, user profiles, even weather forecasts, among other data available. A single intelligence data source can also enable more empowerment and fewer restrictions regarding API and queries serving internal and external applications.
Elasticsearch Integration:
Enhance Cross-Domain Analytics to Uncover Trends, Detect, Identify, and Geo-locate Anomalous Behaviors or Attacks
What goes in and out of your networks, web properties, and public cloud instances provides a valuable source for understanding legitimate and non-legitimate traffic and the user or service behind it. Organizations are increasingly looking at enriched traffic data, such as geolocation or flow pattern, as critical data for analytics intelligence used by various teams in the organization. Security and risk management teams correlate Kentik’s Firehose data to rapidly detect, analyze, investigate, and actively respond to threats.
Kafka Integration:
Provide Network Observability Data to Application and Storage Consumers Reliably
Kentik KTranslate also provides Kafka integration with AVRO and JSON outputs. Kafka is commonly used in application environments to facilitate internal data flows between applications and systems. Organizations can use Kentik Firehose to send Kentik rich network data to a Kafka service from which multiple endpoints can consume the data in their fashion.
InfluxDB Integration:
Enable Real-time and Predictive Analytics Using Time Series Data
Another interesting use case is to export Kentik network observability data to InfluxDB open-source time-series database. InfluxDB is a popular database used for monitoring application and IoT metrics for optimization, preventive maintenance, and early trend detection. Integrating network observability data provides insights on events and conditions detected at the network layer that would lead to disruption.
Prometheus Endpoint Integration:
Close the Network Observability Gap of Cloud-native Kubernetes Full-stack Monitoring
Kentik Firehose also supports data output as a Prometheus endpoint. This capability enables critical use cases in cloud deployments because Prometheus is the native Kubernetes monitoring solution for applications and systems metrics. Applications and practically every element in the Kubernetes architecture, control plane, nodes, and add-ons expose metrics data as Prometheus endpoints. Enabling customers to ingest Kentik’s rich data via Prometheus endpoints closes the network observability gap in cloud-native environments.
Kentik Firehose Lets You Know of Your Traffic, the Networks Supporting It, and Its Rich Context
Kentik is the only network observability solution that knows your actual traffic across public and private infrastructures (internal, cloud, and internet) and its contextual data (LAN/WAN, device health, BGP, DNS, geo-location, business metadata, cloud structure context, etc.). Understanding what is happening at the network level while delivering real-time intelligence into applications and services enables teams, among other things, to:
- Build better products
- Support better workflows
- Implement more reliable automation
- Provide higher quality services
The use case examples provided are just a few among countless possibilities. The benefits that Kentik Firehose provides grow with an organization’s vision to use data as a foundation to achieve its goals.
How to Access Kentik Firehose
Kentik Firehose is available as part of Kentik Pro and Premier editions. Sign up for a free 30-day trial to try it now or request a demo from the Kentik team.
Kentik KTranslate is available on Github and the Docker hub for anyone who wants to try it.
Key Benefits
- Unify, enrich and correlate network observability data and send it to data sinks or to applications and systems, where deeper value can be extracted
- Close the network observability data gap in DevOps’ full-stack monitoring
- Enable multi-source streaming analytics to uncover and transform insights using network observability data
- Provide business intelligence with a strong foundation on traffic distribution, network reliability and digital experience
Platform
Solutions
- Reduce Cloud Spend
- Migrate To and From Any Cloud
- Improve Cloud Performance
- Optimize Enterprise WAN
- Network Performance Monitoring
- Deliver Exceptional Digital Experiences
- Detect and Mitigate DDoS
- Harden Network Policy Management
- Investigate Security Incidents
- Visualize All Cloud and Network Traffic
- Troubleshoot Any Network
- Understand Internet Performance
- Optimize Data Center Networks
- Consolidate Legacy Tools
- Optimize Peering and Transit
- Plan Network Capacity
- Reduce Network Spend
- Grow Subscriber Revenue
