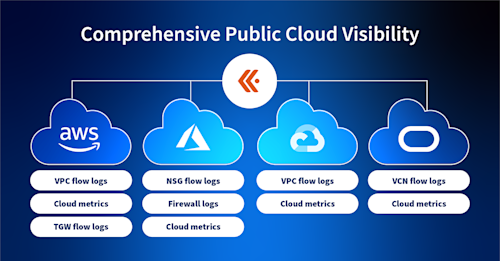
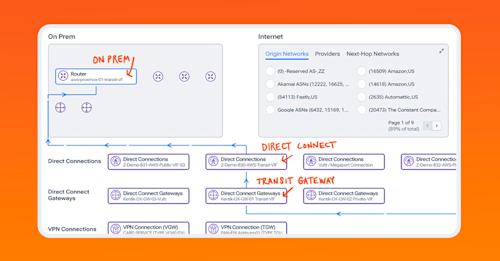
The adoption of multi-cloud is a standard architecture for many organizations today. And though cloud vendors do provide some visibility into their own environments, it's often lacking in features and functionality, not to mention that engineers end up having to use multiple visibility tools to see all their public clouds. Kentik is cloud-vendor agnostic, ingesting telemetry from all the major public clouds. We're collecting flow logs and metrics from AWS, Azure, Google, and Oracle. And we also use synthetic tests to trace the path on the public internet to understand network performance between public cloud regions, cloud providers, and, of course, your on-prem resources. In this short video, let's take a look at how Kentik from a high level provides network observability of multiple public clouds in one place. So here we are in the Kentik Map, which gives us a good starting point, pretty much an overview of our configured and discovered sites on-premises and public cloud. And you could see here on your screen multiple public clouds. So, again, it's a basic high level overview of so much of that information that exists in the underlying database that we're ingesting into the system. And you can actually go in a lot of different directions to explore that data right from here. A lot of these elements that you see on the map are clickable. So for example, we could start with some very basic filtering using this menu here and, and the variety of options that we can filter on. It's pretty extensive as you can see here as I scroll down. Now we can also look at the high level connections of each of our individual clouds. So for example, I'm gonna start with AWS, click on Show Connections, and you could see a quick quick overview of the total traffic going from AWS to the public internet. And then, of course, you can filter on that for things like application, let's see, TCP flags, country, region, ASN, whatever is important to you. And then we can get the same thing by clicking on this link here, but between AWS overall and our on premises locations, which again is a total amount of traffic and something that you can filter as well. So if you notice here, I can zoom in on a location like this one here in Northern Virginia, and you could see all the locations represented there, which include, it looks like, some data centers, connections to several clouds. And here you could see that we even have the links listed as well. So it gets pretty granular right from here. So to focus on a specific cloud, let's start with AWS. I'm gonna click on View Topology, and that'll get us visibility into the traffic for that specific cloud, and you could see that here. And so you could trace a path from a specific on-prem router and then whatever site you're interested in. In this case, we're gonna trace from, the on-prem router through this specific Direct Connect, this Direct Connect gateway, and then down here to this transit gateway, all of which can be expanded so you can see the detailed metrics for each of those elements. And so now we can even expand this, the transit gateway, show the connections here, and then see how traffic is moving within the region. And, again, each of these elements represents a lot of data. So we could start to explore all that data from here, if we open the details pane. And then depending on what kind of a network element it is, you'll see all sorts of flow data, metrics, metadata, security information. And then all of that, of course, can be filtered in different ways depending on what kind of data it is and then what you need. Another way to get a snapshot of overall cloud activity is by using the Kentik Cloud dashboard, which is a completely customizable dashboard to meet your needs. So for this example, for this demo, for illustrative purposes, I have it set up to to show what's important to me. And in this case, I have various elements like VPCs, Direct Connections, NAT gateways here in AWS. I have VNets, load balancers, and some other elements here in Azure. Scrolling down, I have some overview information about total cloud traffic. We could see it broken down by cloud. And I have some dashlets about information. Again, that's important to me. Like, you can see here I have AWS security group rejects actions, listed. And, of course, I'd also integrate that with my alerting system and alert on those from here. I have information about Google, enter VPC traffic, gateway traffic, and so on. Now this is more a dashboard of individual clouds but all in one place, which is really helpful. But let's take a look at how we can actually see traffic moving from cloud to cloud and then filter that data in a very granular way. So now I'm in Data Explorer, which is the mechanism that we use to explore that entire underlying database of telemetry that we've ingested into the system. And we can use it to set up very simple or very complex filtering. So in the context of multi-cloud visibility, let's start with something simple. I'm gonna filter for, our public clouds, of course, and then for a source and destination cloud provider. Break it down that way. I want to see the IP address. I'd like to see firewall action. And, of course, you want a specific time frame. Now this is pretty simple. But if you want to, you can add more filters to to see specific applications, customer tags, different time ranges, and so on. Now the results here show us traffic going from Azure to AWS. You could see the specific IP address, the firewall action, and, of course, the volume of traffic. So this is pretty basic, but we can get pretty granular pretty quickly if you like to, to look at things like metrics of a specific internet gateway, maybe isolate specific geographic regions or ASNs or countries, or look at specific TCP flags for whatever reason, maybe for a postmortem security audit. Next, we can also look at the traffic in between public clouds going over the internet. Now there are a few ways that we can do this within the platform. So let's look at just one for this demo. Now on the Synthetics dashboard, take a look at this pretty simple mesh of tests that I have running. These are synthetic tests that are deployed in various public clouds and which can be deployed in your own public cloud instance as well. And you can use those to continually test performance as well as move up the stack into application activity between public clouds, again, over the internet. So I'll select this test here between AWS and Google, and you could see here that we have metrics for loss, latency, and jitter. And when opening up the details, we can expand our time frame and see this over time and look at the path trace to see those same metrics hop by hop, again, over the public internet. The days of sitting in a cubicle and accessing applications that live on servers down the hall are all but over. Today, most organizations are running multiple cloud providers and juggling multiple cloud visibility tools to piece it all together. Kentik ingests it all and puts it into context so that you could see all your public clouds in one place. To learn more, visit kentik.com/cloud or reach out to your Kentik representative.
Multi-cloud visibility is a challenge for most IT teams juggling multiple tools and screens to understand application traffic across multiple public clouds. Kentik unifies telemetry from the major cloud providers and the public internet into one place to give you the ability to monitor and troubleshoot application performance across AWS, Azure, Google, and Oracle clouds for real-time and historical analysis.
Platform
Solutions
- Reduce Cloud Spend
- Migrate To and From Any Cloud
- Improve Cloud Performance
- Optimize Enterprise WAN
- Network Performance Monitoring
- Deliver Exceptional Digital Experiences
- Detect and Mitigate DDoS
- Harden Network Policy Management
- Investigate Security Incidents
- Visualize All Cloud and Network Traffic
- Troubleshoot Any Network
- Understand Internet Performance
- Optimize Data Center Networks
- Consolidate Legacy Tools
- Optimize Peering and Transit
- Plan Network Capacity
- Reduce Network Spend
- Grow Subscriber Revenue


